.svg)

.svg)
Comprehensive data compiled from extensive research on legal settlement payments, government disbursements, and digital payment adoption
Key Takeaways
- Government prepaid card programs distribute massive volumes - Federal, state, and local agencies disbursed $183.2 billion through prepaid cards across approximately 1,200 programs in 2024, demonstrating the scale and trust in this payment method for mass distributions
- Digital payments dramatically outperform paper checks - Settlement platforms using digital disbursements achieve 98% payment success rates compared to just 55-77% for traditional paper checks, making digital payments essential for modern claims administration
- Class action participation rates remain critically low - Only 9% of class members submit claims when receiving direct notice, with email campaigns producing average claims rates of just 3%, leaving billions in settlement funds unclaimed annually
- Market growth signals massive opportunity - The global prepaid card market reached $3.60 trillion in 2024 and is projected to grow to $21.46 trillion by 2034 at a 19.55% CAGR, with North America commanding 61% market share
- Cost savings justify platform investment - Digital disbursement platforms reduce settlement processing costs by up to 80% versus paper-based methods while recovering hundreds of hours of administrative time annually
- Claimant preferences favor digital options - When given a choice, 94% of class action payees select digital payments over paper checks, with prepaid cards and digital wallets representing 45% of all payment selections in legal settlements
Market Size and Growth Projections
1. Government agencies disbursed $183.2 billion through prepaid cards in 2024
Government-administered, general-use prepaid card programs distributed $183.2 billion across roughly 1,200 federal, state, and local programs in 2024. This massive disbursement volume demonstrates institutional confidence in prepaid card infrastructure for high-volume, compliance-sensitive distributions. State and local programs accounted for $141.0 billion of this total, with federal programs contributing $42.2 billion. Source: Federal Reserve Board
2. Global prepaid card market valued at $3.60 trillion in 2024
The worldwide prepaid card market reached $3.60 trillion in 2024, reflecting broad adoption across consumer, government, and corporate disbursement applications. This valuation positions prepaid cards as a dominant force in the global payments ecosystem, with continued expansion expected across all major regions and use cases. Source: Precedence Research
3. U.S. prepaid card market reached $1.76 trillion in 2024
The United States prepaid card market alone achieved $1.76 trillion in transaction volume during 2024, representing nearly half of the global market. This concentration reflects the mature regulatory environment, widespread merchant acceptance, and established distribution infrastructure that makes prepaid cards ideal for mass payout operations. Source: Precedence Research
4. Market projected to reach $21.46 trillion by 2034
Analysts project the global prepaid card market will expand to $21.46 trillion by 2034, representing a compound annual growth rate of 19.55% from 2025 to 2034. This growth trajectory reflects accelerating digital payment adoption, expanding financial inclusion initiatives, and increasing corporate and government reliance on prepaid disbursement mechanisms. Source: Precedence Research
5. U.S. prepaid and digital wallet market expected to reach $749.46 billion by 2025
The combined U.S. prepaid card and digital wallet market is projected to achieve $749.46 billion by 2025, growing at 11% annually. This convergence of prepaid and digital wallet functionality creates opportunities for unified platforms that serve both banked and unbanked populations effectively. Source: Yahoo Finance
6. North America dominates with 61% market share
North America commanded 61% of the global prepaid card market in 2024, driven by established regulatory frameworks, high merchant acceptance rates, and sophisticated distribution networks. This regional dominance creates competitive advantages for U.S.-based platforms serving legal settlement and claims administration markets. Source: Precedence Research
Legal Settlement Disbursement Performance
7. Class action settlements totaled $42 billion in 2024
Total class action settlement values reached $42 billion in 2024, marking the third consecutive year exceeding $40 billion. Ten settlements individually exceeded $1 billion each, demonstrating the scale of disbursement operations required in modern claims administration. Source: Milberg
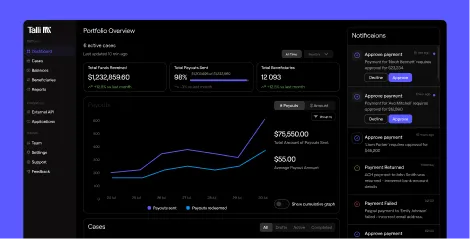
8. Digital payments achieve 98% success rate versus 55-77% for checks
Settlement platforms utilizing digital payment methods report 98% payment success rates, dramatically outperforming paper checks which achieve only 55-77% cash rates in cases with claims processes. This performance gap directly impacts fund distribution efficiency and claimant satisfaction outcomes. Source: Talli
9. Only 9% of class members submit claims when receiving direct notice
Despite direct notification, only 9% of eligible class members actually submit claims, leaving over 90% of potential recipients without their entitled funds. Email notice campaigns perform even worse, producing average claims rates of just 3%. These participation gaps represent billions in unclaimed settlement dollars annually. Source: Talli
10. 94% of payees select digital payments when offered a choice
When class action payees receive payment method options, 94% choose digital payments while only 6% select paper checks. This overwhelming preference validates investment in digital disbursement infrastructure and supports the case for expanding digital payment options across all settlement campaigns. Source: Talli
11. Prepaid cards and digital wallets represent 45% of payment selections
In legal settlements offering multiple payment options, prepaid cards account for 23% of selections while digital wallets capture 22%, combining for 45% of total payment choices. This distribution demonstrates a strong claimant appetite for non-check alternatives that provide immediate access to funds. Source: THE GLOBAL PAYMENTS REPORT
Cost Efficiency and Processing Metrics
12. Digital platforms reduce settlement processing costs by up to 80%
Claims administrators implementing digital disbursement platforms report cost reductions of up to 80% compared to paper-based processing methods. These savings stem from eliminated printing, postage, and manual handling expenses combined with reduced exception processing and reissuance requirements. Source: settlemint
13. Poor data quality costs organizations $12.9 million annually
Settlement administrators face average annual costs of $12.9 million from poor data quality, according to Gartner research. These costs manifest through incorrect claimant targeting, failed payments requiring reprocessing, and extended administrative cycles that delay fund distribution and increase operational burden. Source: Gartner
14. Only 53 cents of every tort dollar reaches actual claimants
Research indicates only 53 cents of every dollar in the tort system reaches actual claimants, with 47% consumed by litigation costs, administrative fees, and processing inefficiencies. Efficient disbursement platforms help maximize the percentage of settlement funds that reach intended recipients. Source: U.S. Chamber of Commerce
15. U.S. tort system costs $529 billion annually
The American tort system imposes costs of approximately $529 billion annually, equivalent to roughly $4,200 per household. Streamlined disbursement processes represent one mechanism for reducing this burden while ensuring claimants receive their entitled compensation more efficiently. Source: U.S. Chamber of Commerce
Transaction Volume and Card Circulation
16. Government prepaid transactions totaled 941.4 million in 2024
Excluding EBT cards, government-administered prepaid card programs processed 941.4 million transactions with a total value of $38.4 billion in 2024. This transaction volume demonstrates the operational capacity of prepaid infrastructure to handle high-volume, government-scale disbursement requirements. Source: Federal Reserve Board
17. Issuers collected $296.5 million in interchange fees on government cards
Issuers of government-administered prepaid cards collected approximately $296.5 million in interchange fees during 2024, reflecting the economic model supporting prepaid card infrastructure. Cardholder fees on these programs totaled an additional $126.6 million. Source: Federal Reserve Board
18. Cards and payments represent 65% of total transactions
Credit and debit cards combined accounted for 65% of total payment transactions in 2024, up from 62% in 2023. This shift away from cash and checks reinforces consumer preference trends favoring card-based payment methods including prepaid disbursements. Source: WalletHub
Claimant Experience and Accessibility
19. 85% of U.S. adults have at least one debit card
The vast majority of American adults—85%—possess at least one debit card, indicating high familiarity with card-based payment acceptance and usage. This penetration supports prepaid card disbursements as an intuitive payment method requiring minimal recipient education. Source: WalletHub
20. 74% of consumers want funds delivered quickly and safely
Consumer research indicates 74% of surveyed individuals prioritize speed and safety in fund delivery. Prepaid cards and digital payment methods address both requirements through immediate fund access and built-in security features. Source: Kroll
21. 46.7% prefer direct deposit while 24% prefer prepaid cards
When surveyed about payment preferences, 46.7% of consumers indicate preference for direct deposit while 24% favor prepaid cards. This distribution supports offering multiple payment options to maximize redemption rates across diverse claimant populations. Source: Kroll
Timeline and Processing Speed
22. Traditional settlements take 2-4 years from filing to distribution
Traditional settlement processes typically require 2-4 years from initial filing to final fund distribution, with complex cases like the BP Oil Spill extending beyond a decade. Modern digital platforms compress these timelines significantly through automated processing and immediate payment delivery. Source: Talli
23. Settlement checks take 6 months to several years reaching claimants
Paper check distribution adds 6 months to several years to claimant wait times after settlement approval. Digital disbursement methods reduce this delivery window to days or even minutes, dramatically improving claimant satisfaction and fund flow transparency. Source: Talli
24. 95% of personal injury cases settle before trial
Approximately 95% of personal injury cases resolve through settlement rather than trial verdict, creating predictable disbursement requirements that benefit from standardized, automated payment processes. This settlement rate reinforces the need for efficient distribution infrastructure. Source: Talli
Market Trends and Future Projections
25. Global debit and prepaid cards projected at 31.13 billion by 2029
Total debit and prepaid cards in circulation worldwide are expected to reach 31.13 billion by 2029, growing from 27.76 billion in 2024. This expansion reflects continued global adoption of card-based payment infrastructure across developed and emerging markets. Source: Nilson Report
26. Combined settlements totaled $159 billion over three years
Class action and mass tort settlements combined for approximately $159 billion in total value across 2022-2024, establishing substantial ongoing demand for efficient disbursement services. This settlement volume requires robust infrastructure capable of handling millions of individual payments. Source: Risk & Insurance
27. Nuclear verdicts reached $31.3 billion in 2024, up 116% from 2023
Nuclear verdicts—jury awards exceeding $10 million—totaled an estimated $31.3 billion in 2024, representing approximately 116% growth from 2023 levels. These expanding award values increase disbursement complexity and reinforce the need for compliant payout solutions with proper fund segregation and audit trails. Source: Talli
Maximizing Settlement Distribution Efficiency
The prepaid card disbursement landscape in 2025 demonstrates clear momentum toward digital-first payment strategies that prioritize speed, cost efficiency, and claimant accessibility. With government agencies already distributing over $183 billion through prepaid programs and 94% of settlement payees preferring digital options, the business case for modern disbursement platforms has never been stronger.
Claims administrators seeking to improve their settlement outcomes should focus on three critical areas: adopting digital payment infrastructure that achieves 98% success rates, implementing data quality processes to reduce the $12.9 million annual costs of poor data management, and offering multiple payment options including prepaid cards to serve both banked and unbanked populations effectively.
The projected growth to $21.46 trillion in global prepaid card transactions by 2034 signals sustained market expansion and technological innovation. Early adopters of comprehensive digital disbursement platforms will capture competitive advantages through reduced processing costs, accelerated fund distribution timelines, and enhanced claimant experiences that drive higher participation rates and better settlement outcomes.
Frequently Asked Questions
How do prepaid cards improve legal settlement distribution efficiency?
Prepaid cards achieve 98% payment success rates compared to 55-77% for paper checks, eliminating common issues like returned mail, stale-dated checks, and bank processing delays. They also reduce per-payment costs from $7.78-$20+ down to under $1, while providing immediate fund access for claimants regardless of their banking status.
What percentage of claimants prefer prepaid cards over other payment methods?
When given multiple payment options, 23% of settlement claimants select prepaid cards while 22% choose digital wallets, combining for 45% of non-check payment selections. Overall, 94% of payees prefer digital payment methods over paper checks when offered a choice.
Are prepaid card disbursements compliant for legal settlements?
Yes, prepaid card programs from regulated issuers like Patriot Bank, N.A., Member FDIC meet legal disbursement requirements. Platforms like Talli integrate KYC, OFAC screening, W-9 collection, fraud mitigation, and audit logs to ensure full compliance throughout the disbursement lifecycle.
How do prepaid cards serve unbanked settlement claimants?
Approximately 6% of U.S. households (14.1 million adults) lack traditional bank accounts. Prepaid cards provide these claimants immediate access to settlement funds without requiring bank account information, ensuring equitable distribution across all eligible recipients.
What is the projected growth for the prepaid card market?
The global prepaid card market is expected to grow from $3.60 trillion in 2024 to $21.46 trillion by 2034, representing a 19.55% compound annual growth rate. The U.S. market alone is projected to continue its strong growth trajectory, driven by expanding digital payment adoption and government disbursement programs.